Breathing Algorithm
Device Factory services provides data mining and analysis consulting on a proprietary basis. Here you will find our analysis of Algorithmic Detection of Breathing Cycle using data collected from our DF1 device. For fees associated with this service please contact us directly.
Our body moves in tandem with breathing. Especially in the upper torso area, the rise and fall of the chest is prominently associated with breathing. When placed near key spots, breathing cycle can be inferred from movement data alone. The xyz values from the accelerometer can be used to derive cyclical human breathing pattern.
The key elements of the algorithm is to filter out as much noise from the data as possible, and apply the appropriate algorithm on the transformed data. In practical implementation, the algorithm also has to run in realtime, and refine its estimation from streaming data. A person normally takes about 2-5 seconds (0.5 – 0.2Hz) to complete a full inhale and exhale cycle. Assuming a single breathing cycle completes within 2-5 seconds, you only need about 1-2 data points per second to detect a frequency in theory. With 5Hz sampling frequency, it becomes feasible to tackle breathing detection using captured xyz acceleration values.
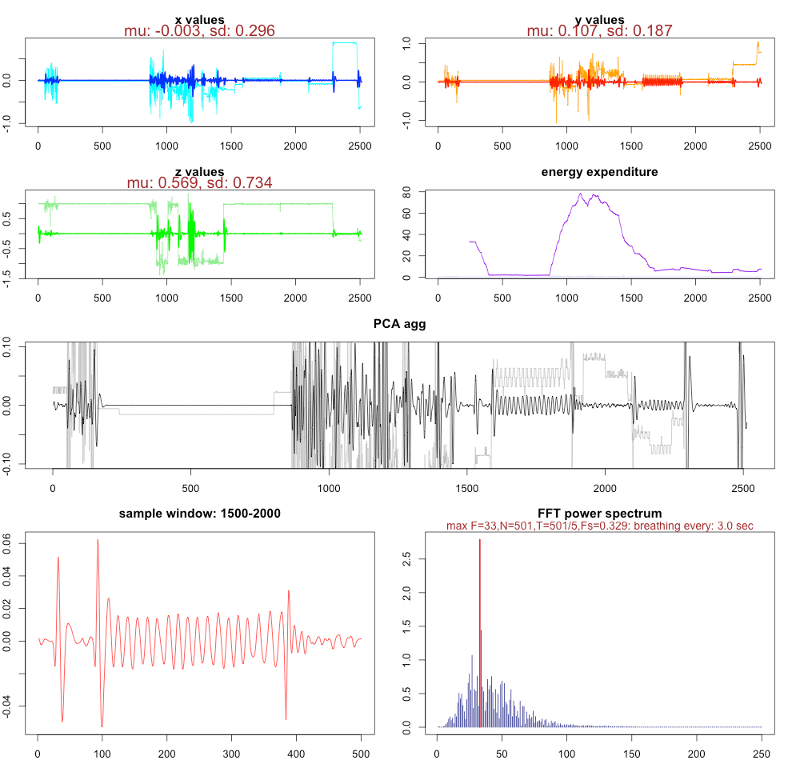
The following plots illustrate this. From left to right, going down each row, you will see:
- x acceleration values and its corresponding high and low pass filtered timeseries
- y acceleration values and its corresponding high and low pass filtered timeseries
- z acceleration values and its corresponding high and low pass filtered timeseries
- plot showing the “activity level”, expressed by the euclidean norm of change in xyz values
- all 3 axis aggregated by their proportional weight in the variances, where their collinearity is taken into account by eigenvalue-based weights
- we zoom into a particular sample patch in the aggregated time series, where clean sinusoidal signal can be extracted
- running discrete fourier transformation on the zoom-ed in sample, and the red bar highlights the prominent frequency
The highlighted frequency coincides with the rate at which the subject was breathing. Our device was placed at various places on the body, while the sample was being collected in realtime. The strongest signal was obtained when our device was placed near the upper torso. The data transmission was done wirelessly at 5 times a second to an iPhone. The iPhone recorded all data received and persisted it into a csv file, which was used for this analysis.
The implementation of the algorithm can be done without much need for complex computation. Also, less than 2 minutes worth of 5 Hz samples (2*60*5 = 600 data points), need to be kept in memory to get sufficiently reliable readings. The data should be maintained in a queue, and the most recent data points should replace the older data points. We will be working on sample application to illustrate this algorithm in action.

